
The US leveraged loan market slowed in August after months of strong gains, with spreads tightened and sector dispersion widened. Borrower-friendly technicals remain intact, but investors face a market where yield opportunities persist even as the margin for error narrows.
The Morningstar LSTA US Leveraged Loan Index’s return in August was the weakest in the last four months, as secondary prices declined and a risk-off tone emerged among investors. Record repayment volumes and ongoing technical strength highlight that conditions still favor borrowers, though the softer performance suggests investors may face a more complex backdrop of narrowing spreads and greater dispersion heading into year-end.
Figure 1: Monthly US Leveraged Loan Returns
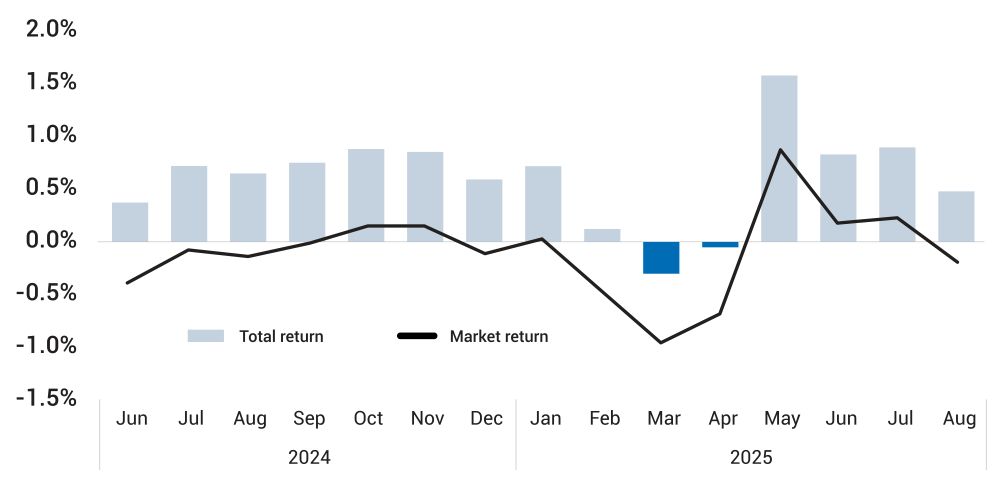
Sources: PitchBook | LCD, Morningstar LSTA US LL Index, data as of August 31, 2025
Performance Moderates After Summer Gains
The leveraged loan index gained 0.45% in August, a marked slowdown compared with prior months, as per PitchBook. The average bid slipped 22 basis points to 97.19, and the share of loans priced at par or higher declined to 41% from 47%. Risk appetite weakened, with CCC-rated facilities falling 0.76% while BB-rated loans edged higher by 0.50%.
Even with this moderation, loans have delivered a 4.17% YTD return, ahead of historical averages, as per PitchBook. Elevated base rates have boosted floating-rate coupons, ensuring steady income. Yet market value is down 1.15% this year, ranking among the weakest outcomes of the past decade. Returns are being sustained by coupon income rather than gains in secondary pricing, a dynamic that limits capital appreciation potential.
Supply Rebounds but Remains Concentrated
Primary activity, including repricing, fell to $51.8 billion in August after July’s record-setting $224 billion, though it still marked the busiest August on record, as per PitchBook. Net new issuance totaled $14 billion, the highest for the month since 2017, led by large financings such as TransDigm’s dividend recap, DuPont’s Qnity spin-off, and Turquoise’s resort acquisition loan. This supply is notable for its scale, yet most transactions were concentrated among a small group of issuers.
For investors, the rebound offers incremental supply but limited diversification. Roughly 70% of July’s issuance was repricing-related, showing how refinancing activity still dominates, as per PitchBook. While M&A-related issuance is up 33% YoY and signals ongoing corporate confidence, much of the flow reshuffles existing exposure rather than adding new avenues for diversification.
Repayments Reinforce Borrower Advantage
Repayments surged to $53.9 billion in August, the highest monthly figure on record, as per PitchBook. Even with July’s elevated issuance feeding into the index, demand continued to outpace supply by $13.6 billion. The cumulative shortfall for 2025 totals $56.2 billion, a significant improvement from last year’s $145 billion deficit but still a sign of tight market conditions.
This imbalance explains why spreads have resisted wider moves despite softer pricing. Capital is being recycled into repricings that compress spreads, leaving investors with fewer high-margin choices. Borrowers retain the upper hand, while lenders must work harder to justify risk-adjusted returns in an environment defined by scarce supply and intense competition for allocations.
Institutional and Retail Demand Diverge
CLO issuance reached $18.5 billion in August across 38 deals, slightly lower than July’s peak but still above the 2025 average, as per PitchBook. YTD activity of $141 billion is running ahead of 2024, with middle-market CLOs building share alongside broadly syndicated issuance. Institutional demand, therefore, remains a consistent anchor of support for the asset class.
Retail participation has turned negative again, with $86.8 million in outflows during August, bringing YTD outflows to $4 billion, as per PitchBook. Expectations of lower interest rates have dampened enthusiasm for floating-rate funds. Institutional flows continue to provide stability, while retail outflows create fragility at the margin, particularly in riskier or less liquid credits.
Compressed Spreads Limit Relative Value
Secondary yields held steady at 8.34% in August, down from the April high of 9.29%, as per PitchBook. Spread-to-maturity tightened to 391 basis points on August 31, close to a six-year low, while nominal spreads fell to 323 basis points, the narrowest since 2010. July’s repricing wave, totaling $159 billion, was instrumental in pushing spreads lower across the board.
The compression has eroded relative value. Loans still provide appealing absolute income, but the premium for taking on additional risk is shrinking. Single-B loans lead 2025 performance with a 4.35% return, yet their advantage over BBs has narrowed, as per PitchBook. Investors are left with fewer opportunities to capture excess return, making credit discipline more critical as spreads approach historic lows.
Sector Dispersion Becomes More Pronounced
Performance varied widely across industries in August. Building Products delivered a 2.12% return, while Trading Companies and Distributors advanced 0.87%, as per PitchBook. Moreover, aerospace and Defense slipped 0.74% as Cubic Corp. weighed on results after a downgrade. Software, which represents the largest share of the loan index, gained just 0.29%, while Chemicals fell 0.32% on weak earnings from Trinseo and Ineos.
This divergence signals that sector fundamentals are exerting greater influence on outcomes. Smaller sectors with concentrated exposures will likely move sharply, but underperformance in a heavyweight category such as Software shows that dispersion is broadening. Investors need to rely more on sector-level analysis, as broad market momentum is no longer enough to offset uneven credit fundamentals.
Conclusion
August marked a pause in the leveraged loan rally, not a reversal. Market dynamics are still shaped by strong repayment activity and consistent institutional demand, yet tighter spreads, fragile retail flows, and rising sector dispersion suggest investors face a more nuanced environment. For those seeking yield, leveraged loans continue to deliver, yet the margin for error is shrinking. Careful credit selection, sector focus, and relative value analysis are essential for generating alpha as the market enters the final stretch of 2025.
About SG Analytics
SG Analytics (SGA) is a global leader in data-driven research and analytics, empowering Fortune 500 clients across BFSI, Technology, Media & Entertainment, and Healthcare. A trusted partner for lower middle market investment banks and private equity firms, SGA provides offshore analysts with seamless deal life cycle support. Our integrated back-office research ecosystem, including database access, design support, domain experts, and tech-enabled automation, helps clients win more mandates and execute deals with precision.
Founded in 2007, SGA is a Great Place to Work® certified firm with 1,600+ employees across the U.S., the UK, Switzerland, Poland, and India. Recognized by Gartner, Everest Group, and ISG and featured in the Deloitte Technology Fast 50 India 2023 and Financial Times APAC 2024 High Growth Companies, we continue to set industry benchmarks in data excellence.